WHO TRS 961 / GDP mapping
Temperature Mapping Data Loggers for Pharma Warehouses, Cold Rooms & Chambers
Temperature mapping is a documented study that places calibrated data loggers across a storage area, records temperature (and often humidity) for a defined period, and shows where the hot and cold spots are and whether the whole space stays within its limits. Pharma warehouses, cold rooms, walk-in chambers and stability chambers need it before use, after major changes and at regular intervals. This page is for QA, validation and engineering teams planning a mapping study. Ideabytes IoT supplies the mapping loggers, probes and 21 CFR Part 11 compliant reports; your validation team or partner writes the protocol and runs the study.
- GeM registered
- 21 CFR Part 11 reports
- Made in India
| Study step | What the guideline expects | Logger requirement |
|---|---|---|
| Sensor count and grid | WHO TRS 961 Annex 9, Supplement 8 describes a three-dimensional grid: points along the length and width, typically every 5 to 10 m in warehouses, at low, middle and top rack heights, plus doors, walls and cooling units. | Enough channels to cover every grid point at once; multi-channel PT100 loggers or a batch of identical standalone loggers. |
| Study duration | Long enough to capture normal operating cycles: commonly 24 to 72 hours for chambers and cold rooms, and commonly a full week (seven consecutive days, including a weekend) for warehouses; confirm the duration in your protocol against the current WHO guidance. | Memory and battery that outlast the study with margin, so no logger stops early. |
| Recording interval | Short enough to see door openings, defrost cycles and compressor swings; 1 to 15 minutes is typical, with 5 minutes common. | Configurable interval, and a synchronised start so all readings line up in time. |
| Calibration before and after | Every logger calibrated against a traceable reference at points bracketing the storage range, with a post-study check to prove no drift. | A calibration certificate per logger or probe, matched by serial number. |
| Empty and loaded studies | Map the space empty to understand the equipment, then loaded to reflect real stock, airflow and door traffic. | Loggers that can be fixed to racks and pallets without blocking airflow. |
| Seasonal repeat | Map ambient warehouses in the hottest and coldest seasons, and repeat after changes to layout, HVAC or refrigeration. | Reusable loggers with a recalibration plan between campaigns. |
| Hot and cold spot identification | Analyse maximum, minimum and mean per point, identify the worst locations, and fix permanent monitoring sensors there. | Exportable raw data (CSV or PDF) for statistical analysis. |
| Mapping report | Protocol reference, layout drawing with logger positions, calibration evidence, raw data, graphs, deviations, conclusions and recommended monitoring points, approved by QA. | Tamper-evident records and an audit trail that stand up to inspection. |
Temperature mapping vs temperature monitoring
Mapping and monitoring answer different questions. A temperature mapping study is a time-bound qualification exercise: dozens of loggers, a written protocol, a fixed duration, and a report that says whether the space is fit for use and where the extremes sit. Continuous temperature monitoring is the permanent system that runs every day afterwards, with a small number of sensors placed at the positions the mapping study identified, plus alarms and records.
Both are expected under WHO GDP and GMP. Mapping without monitoring proves the room was fine for one week; monitoring without mapping cannot show that its sensors sit where the risk is.
Temperature mapping protocol: what to agree before the study
A temperature mapping protocol is approved by QA before a single logger is placed. It defines the scope (which room, chamber or warehouse, empty or loaded), the acceptance criteria (for example 2 to 8 °C or 15 to 25 °C at every point), the logger grid with a layout drawing, the recording interval and study duration, the calibration evidence required, and how deviations such as a power cut or a door left open will be handled.
Agree the logger list with your supplier at this stage, so that channel count, probe cable lengths, humidity capability and calibration points all match the protocol rather than being improvised on the day.
Temperature mapping equipment: which data loggers suit a mapping study
The right temperature mapping equipment depends on the space. For chambers, cold rooms and freezers, a multi-channel logger with PT100 probes covers many points cheaply: one IBI-OTR8 logs eight probes on one clock, and the IBI-OTR4 handles four. They run standalone on an internal battery, store 40,000 records and download over USB or Wi-Fi as CSV. Probe cable lengths can be customised.
For large warehouses where points are scattered across racks, small standalone USB loggers are easier to place. The IBI-UT70 and IBI-UTH70 (temperature plus humidity) record 14,400 readings, run for up to 90 days at a 10-minute interval and generate an encrypted PDF report when plugged in. Where the team wants to watch data live during the study, the Wi-Fi IBI-WTR8 and 4G IBI-MTR8 send readings to the cloud dashboard.
How many data loggers for temperature mapping?
There is no single number; the protocol sets it from the size and risk of the space. As a planning guide only:
- Small chamber or walk-in cold room: commonly 9 points (eight corners and the centre), rising to 15 or more for larger rooms
- Stability chamber: points at each shelf level and the corners, following your chamber qualification protocol
- Warehouse: a grid every 5 to 10 m along the length and width at three heights, so a 20 m by 30 m store on a 10 m grid needs about 36 points
- Extra points at doors, dock levellers, walls exposed to sun, and near air handlers or evaporators
Calibration certificates for every mapping logger
A mapping study is only as good as its loggers. Inspectors expect each logger or probe to be calibrated before the study at points that bracket the storage range, and many protocols add a post-study check to prove no drift occurred. Keep the certificates with the report, matched by serial number to the layout drawing. NABL-traceable calibration certificates are available on request for Ideabytes loggers; see our calibration certificate guide for what a valid certificate must contain.
WHO, FDA, USP <1079> and Revised Schedule M expectations
WHO TRS 961 Annex 9, Supplement 8 (Temperature mapping of storage areas) is the most widely used reference for pharmaceutical temperature mapping and is the basis of most Indian protocols. USP <1079> and its supporting chapter on mapping for storage-area qualification cover the same ground for US-regulated products. The FDA does not publish a standalone mapping guideline; inspectors apply the 21 CFR Part 211 storage requirements and expect a qualified space.
In India, Revised Schedule M and WHO GDP expect storage areas to be kept and monitored under their labelled conditions, and inspectors increasingly ask for mapping evidence that monitoring sensors are in the right places.
From mapping study to continuous monitoring
The mapping report should end with recommended permanent monitoring positions: normally the hottest and coldest points found, plus a representative point. Ideabytes connected loggers such as the IBI-WTH120 (Wi-Fi) or 4G models then monitor those positions around the clock with SMS and app alerts, MKT values, audit trails and 21 CFR Part 11 compliant reports.
Ideabytes supplies the loggers, probes and documentation. Mapping-study execution, including the protocol, analysis and report, is done by your validation team or a validation partner of your choice.
Loggers with WHO TRS 961 / GDP mapping support
Every listed model produces tamper-evident, audit-ready reports from the Ideabytes cloud.
Showing 8 products
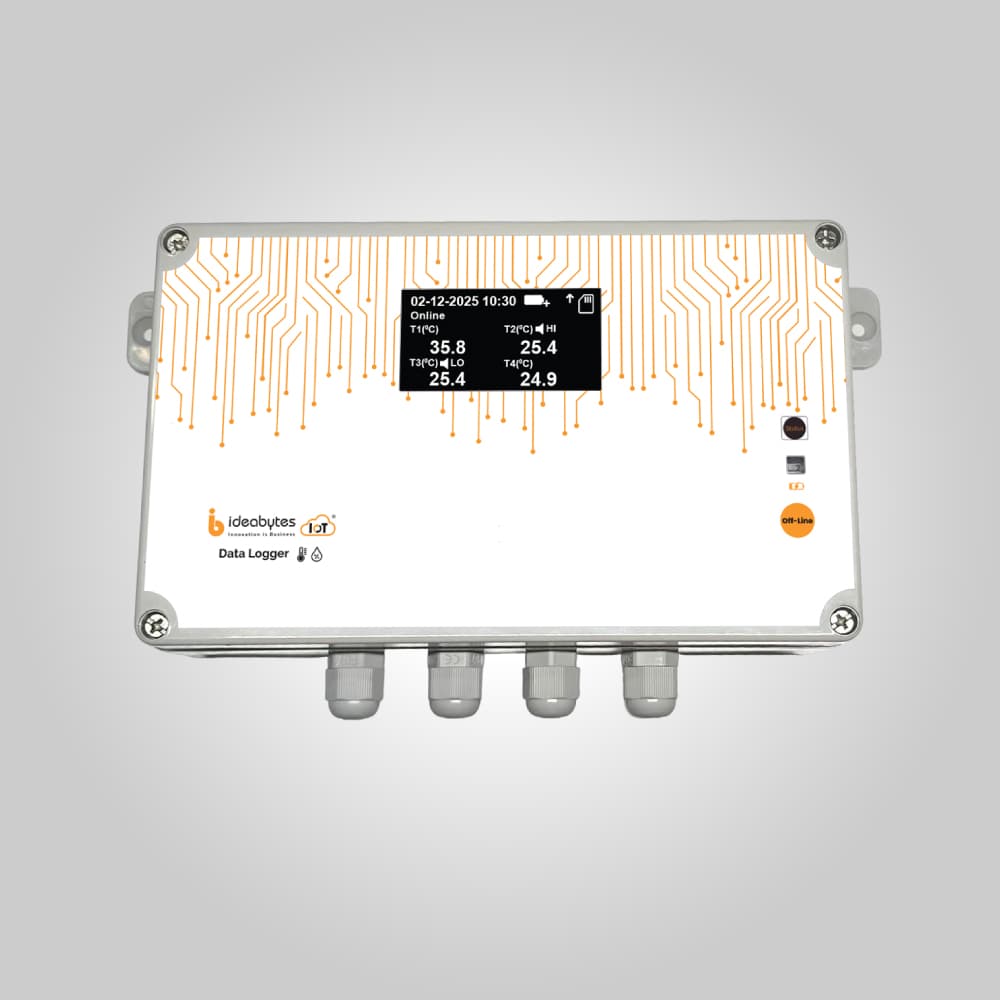
IBI-OTR8 | Offline 8 Channel Temperature Data Logger
Measuring Range PT100 : -200°C to 550°C | PT1000 : -200°C to 550°C (Optional)
- •Plug & Play Device
- •0.5°C (0.05% of Full Scale) Accuracy
- •2.4" 128X64 OLED monochrome Graphical Display
IBI-OTR4 | Offline 4 Channel Temperature Data Logger
Measuring Range PT100 : -200°C to 550°C | PT1000 : -200°C to 550°C (Optional)
- •Plug & Play Device
- •0.5°C (0.05% of Full Scale) Accuracy
- •2.4" 128X64 OLED monochrome Graphical Display

IBI-UT70 | USB Temperature Data Logger
Measuring Range from -30°C to +70°C
- •Battery life up to 90 days
- •Software for configuration
- •Replaceable battery

IBI-UTH70 | USB Temperature & Humidity Data Logger
Measuring Range from -30°C to +70°C | Humidity from 1% RH to 99% RH
- •Battery life up to 90 days
- •Software for configuration
- •Auto generating Encrypted PDF report through USB, no additional software required

IBI-WTR8 | Wi-Fi 8 Channel PT100 Temperature Data Logger (8 Temperature)
Measuring Range PT100: -200°C to 550°C | PT1000: -200°C to 550°C (Optional)
- •Wi-Fi 802.11 b/g/n 2.4 GHz Connectivity
- •0.5°C (0.05% of Full Scale) Accuracy
- •2.4" 128X64 OLED monochrome Graphical Display

IBI-MTR8 | 4G M2M 8 Channel PT100 Temperature Data Logger (8 Temperature)
Measuring Range PT100 : -200°C to 550°C | PT1000 : -200°C to 550°C (Optional)
- •4G LTE CAT1 Technology with In-built M2M SIM Connectivity
- •0.5°C (0.05% of Full Scale) Accuracy
- •2.4" 128X64 OLED monochrome Graphical Display
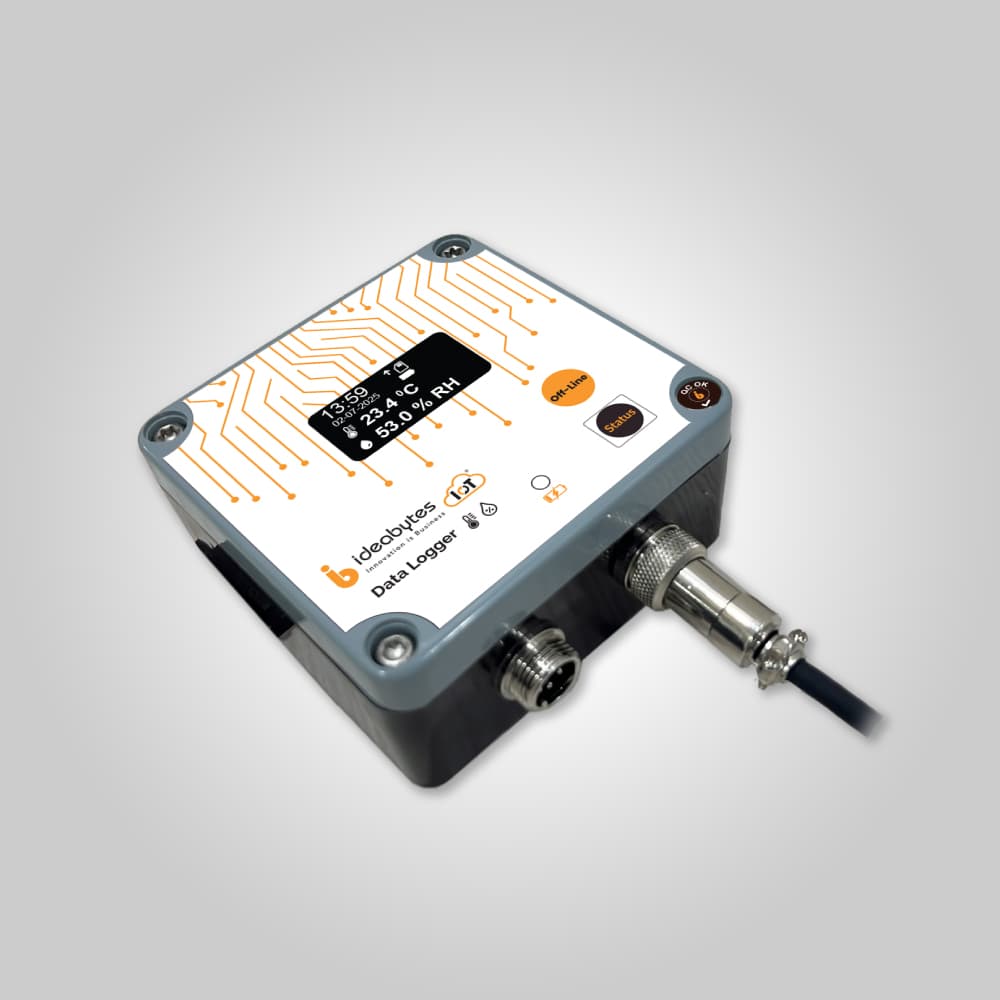
IBI-OTH120 | Offline Temperature & Humidity Data Logger
Measuring Range from -40°C to +120°C
- •±0.5°C accuracy
- •Plug & Play, Wall Mountable Device
- •Data Download Options (Wi-Fi / USB)

IBI-WTH120 | Wi-Fi Temperature & Humidity Data Logger
Measuring Range from -40°C to +120°C | Humidity from 0% RH to 100% RH (Condensing)
- •Wi-Fi 802.11 b/g/n 2.4 GHz Connectivity
- •± 0.5°C (-10°C to +50°C) Accuracy
Applications
Other compliance and buyer guides
Frequently asked questions
What do temperature mapping guidelines require?
Guidelines such as WHO TRS 961 Annex 9, Supplement 8 expect a written protocol, calibrated loggers placed on a three-dimensional grid, a study long enough to capture normal operation, empty and loaded studies where relevant, seasonal repeats for ambient stores, and a QA-approved report that identifies hot and cold spots and sets permanent monitoring positions.
How long should a temperature mapping study run?
Your protocol decides, but chambers and cold rooms are commonly mapped for 24 to 72 hours, while warehouses are commonly mapped for a full week (seven consecutive days, including a weekend), so that working days, idle days and door traffic are all captured. Ambient warehouses are repeated in summer and winter.
Does Ideabytes provide temperature mapping services?
No. Ideabytes supplies the data loggers, PT100 probes, calibration certificates on request and 21 CFR Part 11 compliant reports used in a mapping study. The protocol, execution and report are done by your validation team or a validation partner. After mapping, our connected loggers can take over continuous monitoring.
Can the same loggers be used for mapping and for continuous monitoring?
Yes, if they are calibrated for both uses. Multi-channel PT100 loggers and USB loggers are convenient for the study, and connected Wi-Fi or 4G loggers are placed afterwards at the hot and cold spots it found. Some sites map with the WTR8 or MTR8 and then leave a unit in place for monitoring.
How much does a set of temperature mapping loggers cost?
It depends on the number of mapping points, whether you choose multi-channel PT100 loggers or standalone USB loggers, whether humidity is needed, probe cable lengths and calibration requirements. Send us the dimensions of the space and your protocol grid, and we will propose a logger set and quote.
Is temperature mapping required under Revised Schedule M in India?
Revised Schedule M and WHO GDP expect storage areas to be maintained and monitored under their specified conditions, and Indian inspectors routinely ask for mapping evidence for warehouses, cold rooms and stability chambers. Ideabytes loggers are made in India, Ideabytes is registered on GeM, and NABL-traceable calibration certificates are available on request.
Which logger is best for cold room or stability chamber mapping?
A multi-channel PT100 logger such as the IBI-OTR8 is efficient: eight probes on one clock can cover the corners and centre of a room or the shelves of a chamber. Use the IBI-UTH70 or IBI-OTH120 where humidity must be mapped as well as temperature.
Related reading
Need audit-ready monitoring?
Tell us what you store, how many points you need to monitor and which audits you face. Our team in Hyderabad will recommend a setup and send a quotation.