Temperature monitoring
Warehouse Temperature Monitoring & Mapping
Warehouse temperature control means proving that every pallet position stays within its labelled storage condition, all day, in every season. It has two parts: a temperature mapping study that finds the hot and cold spots in the building, and continuous temperature and humidity monitoring at the points the study identifies. It is required of pharmaceutical warehouses, C&F agents, distributors and 3PL operators handling medicines, and it is good practice for food, chemicals and electronics. Ideabytes IoT supplies 8-channel and 4-channel PT100 loggers for mapping and monitoring, 4G and Wi-Fi temperature and humidity loggers, and a cloud platform with alerts and GDP-ready reports.
- GeM registered
- 21 CFR Part 11 reports
- Made in India
What goes wrong without monitoring
- Roof-level racks in Indian summers run far warmer than the ground floor, and a single wall thermometer never shows it
- Loading bays and dock doors create warm zones that nobody has measured
- Mapping was done once at commissioning and never repeated after racking, HVAC or season changed
- Manual twice-daily readings miss night-time HVAC failures and weekend power cuts
- Humidity is not recorded, so moisture-sensitive products and packaging degrade without evidence
- Inspectors ask for mapping reports, sensor placement rationale and calibration certificates that are not on file
How the system works
- 1Run a temperature mapping study with multi-channel loggers on a three-dimensional grid across the storage area, in summer and winter
- 2Analyse the data to find hot spots, cold spots and the points that best represent the whole area
- 3Install permanent loggers at those points, using 8-channel PT100 units to cover many positions from one device
- 4Connect over 4G or Wi-Fi so every reading reaches the cloud dashboard in real time
- 5Set temperature and humidity limits with SMS and app alerts and a documented response procedure
- 6Review reports and MKT monthly, recalibrate sensors on schedule and re-map after significant changes
Standards and regulators
- WHO GDP
- Revised Schedule M
- CDSCO GDP guidance
- USP <1079> (guidance)
- FDA 21 CFR Part 11
Recommended loggers for warehouse
Selected from the Ideabytes range for this application. All models report to one cloud dashboard with SMS, email and call alerts.
Showing 8 products

IBI-MTR8 | 4G M2M 8 Channel PT100 Temperature Data Logger (8 Temperature)
Measuring Range PT100 : -200°C to 550°C | PT1000 : -200°C to 550°C (Optional)
- •4G LTE CAT1 Technology with In-built M2M SIM Connectivity
- •0.5°C (0.05% of Full Scale) Accuracy
- •2.4" 128X64 OLED monochrome Graphical Display

IBI-WTR8 | Wi-Fi 8 Channel PT100 Temperature Data Logger (8 Temperature)
Measuring Range PT100: -200°C to 550°C | PT1000: -200°C to 550°C (Optional)
- •Wi-Fi 802.11 b/g/n 2.4 GHz Connectivity
- •0.5°C (0.05% of Full Scale) Accuracy
- •2.4" 128X64 OLED monochrome Graphical Display
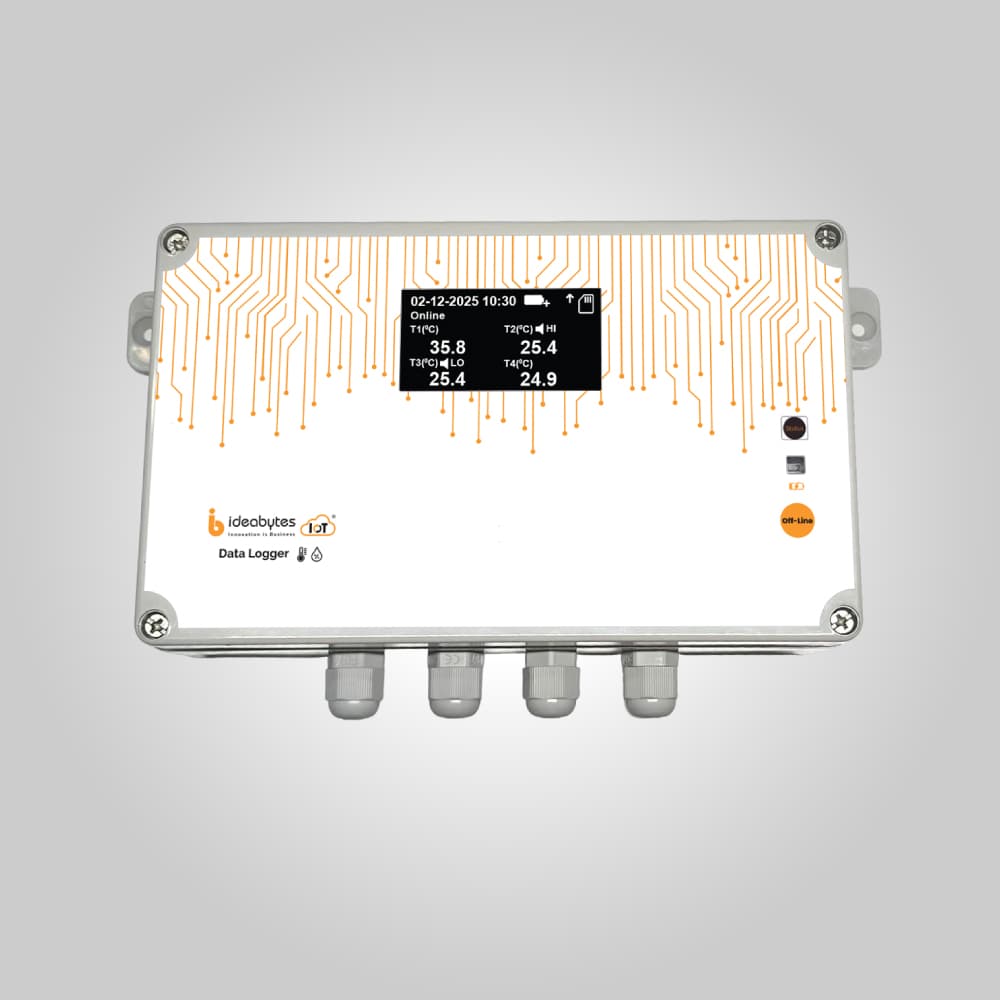
IBI-OTR8 | Offline 8 Channel Temperature Data Logger
Measuring Range PT100 : -200°C to 550°C | PT1000 : -200°C to 550°C (Optional)
- •Plug & Play Device
- •0.5°C (0.05% of Full Scale) Accuracy
- •2.4" 128X64 OLED monochrome Graphical Display
IBI-MTR4 | 4G M2M 4 Channel PT100 Temperature Data Logger (4 Temperature)
Measuring Range PT100 : -200°C to 550°C | PT1000 : -200°C to 550°C (Optional)
- •4G LTE CAT1 Technology with In-built M2M SIM Connectivity
- •0.5°C (0.05% of Full Scale) Accuracy
- •2.4" 128X64 OLED monochrome Graphical Display

IBI-WTH120 | Wi-Fi Temperature & Humidity Data Logger
Measuring Range from -40°C to +120°C | Humidity from 0% RH to 100% RH (Condensing)
- •Wi-Fi 802.11 b/g/n 2.4 GHz Connectivity
- •± 0.5°C (-10°C to +50°C) Accuracy
 Popular
IBI-MTH120 | 4G M2M Temperature & Humidity Data Logger
Measuring Range from -40°C to +120°C
- •4G LTE CAT1 Technology with In-built M2M SIM Connectivity
- •± 0.5°C (-10°C to +50°C) Accuracy

M2M Customized Room Parameter Data Logging & Live Alerting System
4G M2M Customized Data Logger - Sensor & Accessories need to be procure separately
- •4G LTE CAT1 Technology with In-built M2M SIM

Wi-Fi Customized Room Parameter Data Logging & Live Alerting System
Wi-Fi Customized Data Logger - Sensor & Accessories need to be procure separately
- •Wi-Fi 802.11 b/g/n 2.4 GHz Connectivity
Temperature mapping study: finding hot and cold spots
A temperature mapping study places many sensors across the storage area for a defined period, typically at least a week, to show how temperature varies by height, location and time of day. Sensors go on a three-dimensional grid, commonly low, middle and high rack levels every few metres, with extra points near dock doors, walls exposed to the sun, HVAC outlets and the roof. The study is repeated in summer and winter (and in the monsoon if humidity is critical) because Indian warehouses behave very differently across seasons.
The output is a report that identifies the warmest and coldest positions, the areas unsuitable for sensitive stock and the permanent monitoring points. Our step-by-step pharmaceutical warehouse temperature mapping protocol guide explains the method in detail.
Warehouse temperature monitoring system: why 8-channel loggers
A mapping study for a mid-sized warehouse can need dozens of sensors, and continuous monitoring afterwards still needs one point for each zone and rack height. Buying a separate single-probe logger for every point multiplies the devices, SIMs, batteries and calibration certificates to manage. The IBI-WTR8 (Wi-Fi), IBI-MTR8 (4G) and IBI-OTR8 (offline) loggers take eight PT100 probes each (2, 3 or 4-wire, PT1000 optional) with 0.5 °C accuracy, so one device covers a full rack column or a small room. The 4-channel IBI-MTR4 suits smaller zones.
The arithmetic is simple. A store that needs 24 permanent monitoring points can use three 8-channel loggers instead of 24 single-probe loggers: three devices to mount and power, three network connections (or three SIM plans on 4G) and three displays to check, while every probe keeps its own limits, alarms and record. The same logic applies to a bank of walk-in chambers or cold rooms placed next to each other, where probe cables can reach from one central logger.
The offline IBI-OTR8 is well suited to the mapping study itself, storing up to 40,000 records for download over USB or Wi-Fi. The 4G and Wi-Fi models then carry out continuous monitoring with live alerts.
Warehouse humidity monitoring
Many labels say "store below 25 °C, protect from moisture". Humidity matters for tablets, capsules, powders, cartons and labels, particularly in coastal cities and during the monsoon. The IBI-WTH120 and IBI-MTH120 record temperature and relative humidity from one probe, with a humidity accuracy of plus or minus 2% RH. For rooms that need several parameters, such as temperature, humidity and differential pressure, the IBI-WC-X and IBI-MC-X customised room parameter logging systems combine the sensors you choose in one alerting device.
Continuous monitoring after mapping
Mapping is a snapshot; monitoring is the ongoing proof. Once the permanent points are fixed, connected loggers report every 15 minutes by default to the Ideabytes cloud, where the dashboard shows each zone, trend graphs and alarm status. High and low limits for temperature and humidity trigger SMS and app alerts, and the alarm log records acknowledgement and corrective action (CAPA).
Loggers keep recording through network and power outages using internal memory and battery backup, then upload the buffered data. Monthly reports with minimum, maximum and mean kinetic temperature (MKT) values help QA decide whether a brief excursion affected product quality.
Pharmaceutical warehouse temperature monitoring: Schedule M, WHO GDP and GSDP
Revised Schedule M requires storage areas with controlled and monitored temperature and humidity where products need them, with records kept. WHO Good Distribution Practice guidance and its technical supplement on temperature mapping expect storage areas to be mapped, monitoring devices placed on the basis of the mapping results, alarms tested and records retained. CDSCO good storage and distribution practice guidance follows the same principles for Indian distributors. USP general chapter 1079 is often used as further guidance on good storage and distribution practice.
Auditors typically ask for the mapping protocol and report, the monitoring point rationale, calibration certificates for every sensor, the alarm test record and the temperature record for a chosen period. 21 CFR Part 11 compliant PDF reports with an audit trail make that last request quick to answer.
Warehouse temperature control in Indian conditions
Most Indian warehouses are ambient or air-conditioned sheds with metal roofs, high racking and busy dock doors. In April to June, air near the roof can be far warmer than at floor level, and a store labelled "below 25 °C" or "below 30 °C" may fail only on its top rack for a few hours each afternoon. Monsoon humidity creates a second risk for cartons, labels and moisture-sensitive products.
Practical controls include keeping sensitive stock off the top levels identified in the mapping study, sealing dock doors with strip curtains, checking HVAC capacity before summer and treating power cuts as a planned event in your SOP. Continuous monitoring shows whether these controls actually work.
Cost drivers and buying in India
Warehouse monitoring cost depends mainly on the floor area and rack height (which set the number of points), the use of 8-channel versus single-channel loggers, 4G or Wi-Fi connectivity, humidity and other room parameters, whether a mapping study is included, the software plan and calibration. Multi-channel loggers usually give the lowest cost per point. Ideabytes IoT manufactures in India, is registered on GeM and can provide calibration certificates on request. Share your layout drawing for a quotation.
Compliance guides
Frequently asked questions
What is warehouse temperature mapping?
It is a study that places many temperature (and often humidity) sensors on a three-dimensional grid across a storage area for a defined period to find hot and cold spots and variation over time. The results show where products can be stored safely and where the permanent monitoring sensors should be placed. It is normally repeated for summer and winter.
How many sensors does a warehouse temperature monitoring system need?
It depends on floor area, rack height, HVAC design and the mapping results. A typical approach is sensors at low, middle and high rack levels in each zone, plus points near dock doors and other hot or cold spots identified in the mapping study. An 8-channel PT100 logger covers eight of these points from one device.
Why use 8-channel loggers in a warehouse?
One 8-channel logger replaces eight single-probe loggers: one power supply, one network connection or SIM and one device to manage, while each probe still has its own limit and record. That lowers the cost per point and simplifies installation, especially for rack columns and multi-room stores.
How often should a warehouse be temperature mapped?
Map at qualification, then again in the opposite season, and repeat after significant changes such as new racking, HVAC modifications or a change in the building. Many quality systems also set a periodic re-mapping interval, often every few years, based on their risk assessment and the stability of the monitoring data.
How much does warehouse temperature monitoring cost?
It depends on the number of monitoring points, 8-channel or single-channel loggers, 4G or Wi-Fi, humidity and other parameters, whether a mapping study is included, the software plan and calibration. Send us your warehouse layout, rack height and storage conditions and we will prepare a quotation.
What records does an Indian pharma warehouse need for Schedule M and GDP audits?
Usually the temperature mapping protocol and report, the rationale for each monitoring point, calibration certificates for all sensors, alarm test records, excursion records with CAPA and the continuous temperature and humidity record. The Ideabytes platform provides 21 CFR Part 11 compliant reports, alarm logs and MKT values for these audits.
Related reading
Applications
From the blog
Plan monitoring for your site
Tell us what you store, how many points you need to monitor and which audits you face. Our team in Hyderabad will recommend a setup and send a quotation.